
Graphing the monitored servo data
The servo log function in WINCAPS3 can graph the monitored data on a PC screen.
Read monitored servo log data
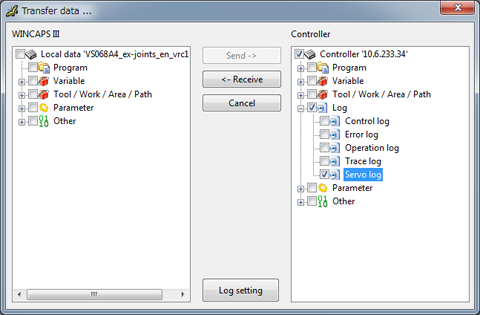
To receive servo log data from the controller, use the data transfer function in WINCAPS3 as follows.
Choose Connect | Transfer data to display the Transfer data window.
In the Controller pane, select Log | Servo log and then press Receive.
the current project in WINCAPS3.
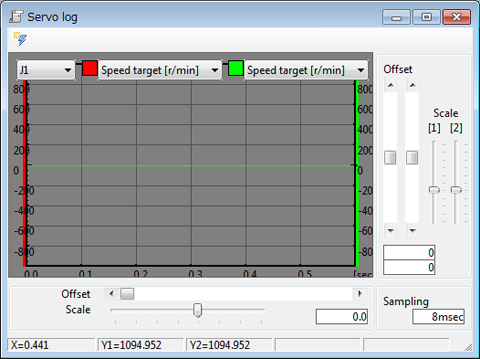
Plot the graph of servo log data
Choose View | Log View | Servo log to plot the graph of the servo log data of the project in WINCAPSIII.
Adjust the scale and offset of the graph and check the graphed data.
Saving the monitored data into a file
WINCAPS3 can save the monitored data into a CSV file.
Select File | Export to display the Export window.
Select Log | Servo log(Log.Srv.csv) and then press the Export button to save the data into a CSV file.