
ID : 11274
Force Control Log
Operation path: [F2 Arm] - [F2 Force Control] - [F2 Force Control Log]
Obtains the logs of the travel distance command values of each axis, travel distance current values, arm end command values, arm end current values, and sensor values and displays them with a graph.
When receiving the control logs, WINCAPSIII receives the force control logs as well. In the [File] menu of WINCAPSIII, the received force control logs can be output in the form of a CSV file.
Displaying the Force Control Logs
Operation path: Top screen - [F2 Arm] - [F2 Force Control] - [F2 Force Control Log]
A bold line in the graph indicates the area where force control is working.
Touching the icon on the upper left will display a pull down menu by which you can switch the operation modes for the graph. The following four types of operation modes are available.
| Operation mode | Description | Left/Right keys |
Up/Down keys | Touch the screen |
|---|---|---|---|---|
 Moving the displayed range |
To move the displayed range of the graph. | Moves the displayed range of the X axis. | Moves the displayed range of the Y axis you select. | Moves the displayed range of the X axis. |
 Scaling the displayed range |
To increase or decrease the displayed range of the graph. | Increases or decreases the displayed range of the X axis. | Increases or decreases the displayed range of the Y axis you select. | Moves the displayed range of the X axis. |
 Changing the selected range |
For details, refer to the following. | Moves the range selection cursor on the X axis. | Not used. | Moves the range selection cursor on the X axis to the position you touch. |
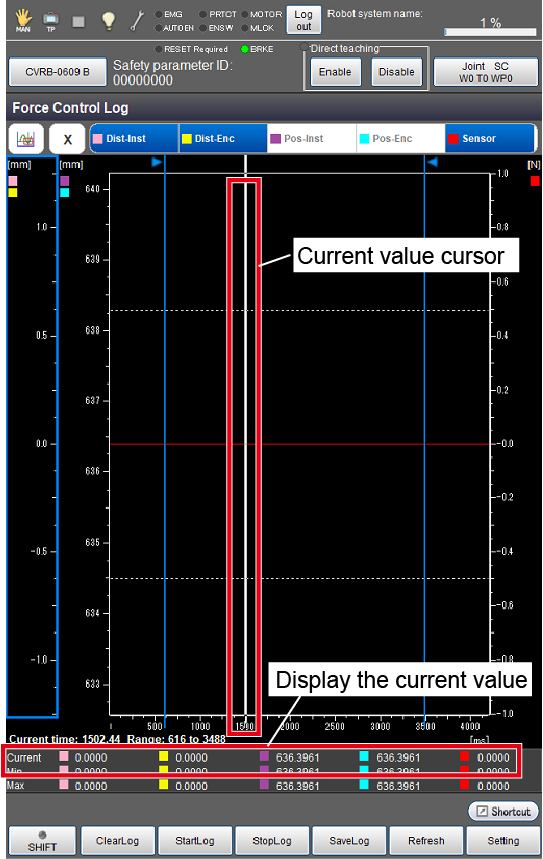
 Checking the current value |
To display the value of a point you select. If you select a point where a robot motion command was executed, "Program" and "Line number" will be displayed on the upper right. | Moves the cursor indicating the current value. | Not used. | Moves the cursor indicating the current value to a point you touch. |
| Keys other than function keys | |
|---|---|
|
|
Pressing this button will display a pull-down menu. Joint-mode data of X, Y, Z. Rx, Ry, and Rz can be displayed. |
| Dist-Inst |
Displays the information of travel distance command values. |
| Dist-Enc | Displays the information of travel distance current command values. The values are based on the force control coordinate system. Selecting this key will display a yellow line graph. |
| Pos-Inst |
Displays the information of arm end command values. |
| Pos-Enc |
Displays the information of arm end current values. |
| Sensor |
Displays the information of sensor values. |

| Available function keys | |
|---|---|
| [F1 Clear Log] | Deletes the obtained force control log information. |
| [F2 Start Log] | Starts obtaining the force control logs. |
| [F3 Stop Log] | Stops obtaining the force control logs. |
| [F4 Save] | Saves the obtained force control log information. |
| [F5 Refresh] | Updates the information displayed on the force control log window of Smart TP. |
| [F6 Setting] | Displays [Force Control Log Setting] where you can check and change the force control log-related settings. |
| [F7 Switch Y-Value display] | Switches how the Y-axis scale is displayed between vertical and horizontal. Setting the Y-axis scale to the vertical direction will increase the displayed range of the graph. |
| [F8 Change axis display range] | Changes the displayed range of the X- or Y-axis. Pressing [F8 Change axis display range] will display the [Change axis display range] window where you can select how to change the displayed range from the following.
|
The force control logs and sensor values displayed in [Monitor] may not be the same as the values detected by the force sensor because the displayed values are compensated values. Therefore, even if the detected values do not exceed the values you have specified, values exceeding the detected values may be displayed on the screen. Conversely, even if the detected values exceed the values you have specified, values not exceeding the detected values may be displayed on the screen.
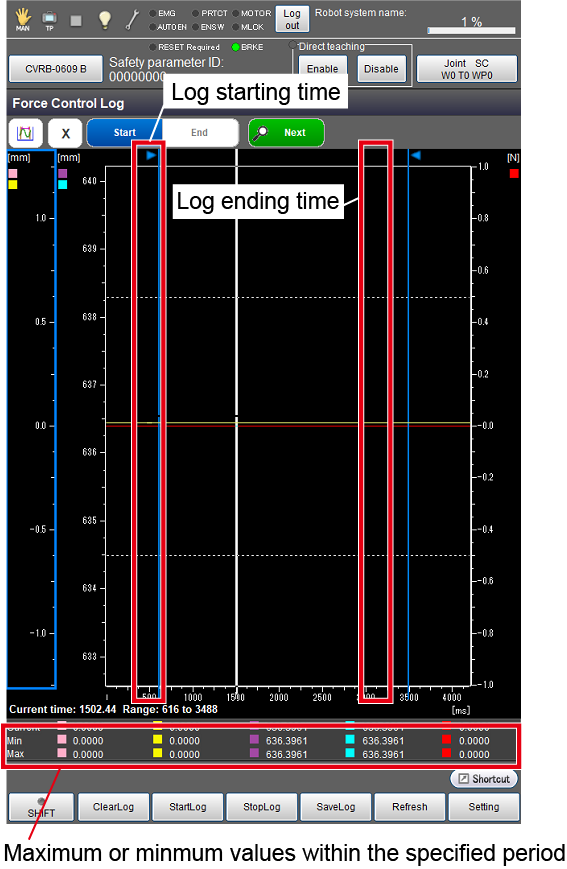
Changing the Selected Range
| Key | Function |
|---|---|
| Start | Sets the starting time of logging. |
| End | Sets the ending time of logging. |
| Next | Jumps to the beginning of the next force control period. |
Sample Program
The following is a sample program for obtaining force control logs.
The logging will start before force control is enabled, and will end when the force control ends.
Sub Main

  TakeArm Keep = 0

  Motor On

  'Initial position
  Move L, P4+(0,0,10)

  ClearLog
  StartLog

  'Register the current values as Point 0 (ON|ONm)
  ForceSensor 0

  Delay 1000

  'Enable the force control in the Table No.1 setting
  ForceParam 1,1,P(0,0,30,0,0,0),Damp = P(100,100,100,100,100,100),SPMax = 100

  'Start the force control
  ForceCtrl True, 1

  'Wait until the conditions are met
  ForceWaitCondition Force = P(0,0,5)

  'Change the control parameters dynamically
  ForceParam 1,1,P(0,0,10,0,0,0), Damp = P(100,100,100,100,100,100), SPMax = 100

  'Rotate around Rz
  Drive (6,45), Speed = 20, Next

  Delay 10000

  'End the force control
  ForceCtrl False

  'End the movement
  Move P, P4+(0,0,10)

  StopLog

End Sub
ID : 11274
- Related Information
- Force Control Log Setting