
ID : 4074
Acquiring, Displaying and Saving Control Log
Operation path : [F2 Arm] - [F3 Servo State] - [CtrlLog tab]
Acquire control logs of respective items including command position, encoder position, current position, and load factor and userdata (SysLog.Ctrl.UserData), and display the graph on the screen of teach pendant.Four items of each joint's control log can be displayed at the same time.
The acquired control log can be saved.
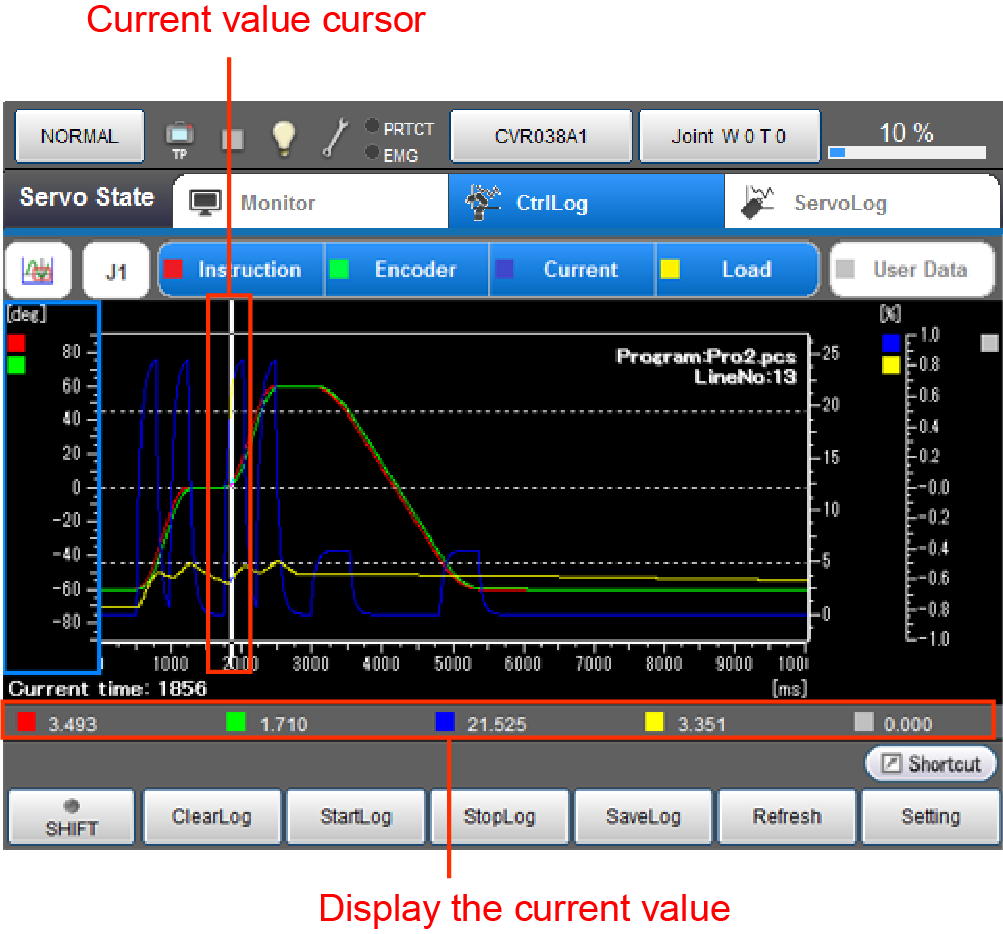
Press [CtrlLog tab] to display the following [Control Log] window.
Touching an icon on the upper left will displays a pull down menu that includes operation mode as shown below. There are four types of operation modes available.
| Operation mode | Description | Right/Left arrow keys | UP/Down arrow keys | Screen touch |
|---|---|---|---|---|
 Move the display |
Shift the display range of the graph axis. | Pressing Right/Left arrow keys will move the display range of the X axis. | Pressing Up/Down arrow keys will move the display range of the selected Y axis. | The display range of the X axis moves. |
 Change the scale |
Expand or contract the display range of the graph axis. | Pressing the Right/Left arrow keys will expand or contract the display range of the X axis. | Pressing the Up/Down arrow keys will expand or contract the display range of selected Y axis. | The display range of the X axis moves. |
 Check the current |
For details, refer to the following Check The Current section. (This function is available in Ver.2.9.* or higher.) |
Pressing the Right/Left arrow keys will move the selection range cursor on the X axis. | Not used. | The selection range on the X axis moves to the position where you touched. |
 Change the range |
Value of the selected range. If you select a position where a robot motion command was executed, "Program" and "Line number" are displayed on the upper right. | Pressing the Right/Left arrow keys will move the cursor indicating the current value. | Not used. | The cursor indicating the current value moves to the position where you touched. |
| Keys other than function keys | |
|---|---|
|
|
Press button to display pull-down menu. |
| Instruction |
Display command position information for the specified joint. [deg or mm] Selecting this item will display a line graph with a red line. |
| Encoder | Display encoder position information for the specified joint. [deg or mm]
Selecting this item will display a line graph with a green line. |
| Current (compared with the rated value) |
Display current position information for the specified joint. [%] Selecting this item will display a line graph with a blue line. |
| Load | Display load factor information for the specified joint. [%] Selecting this item will display a line graph with a yellow line. |
| UserData(SysLog.Ctrl.UserData) |
Display UserData. Selecting this item will display a line graph with a gray line. |

| Available function keys | |
|---|---|
| [F1 Clear Log] | Control log data are initialized. The ring buffer is cleared so that new logs can be saved. |
| [F2 Start Log] | Start acquiring control log. REC on the icon of control log tab turns on when the acquisition of control log is started. |
| [F3 Stop Log] | Stop acquiring control log. REC on the icon of control log tab turns off when the acquisition of control log is completed. |
| [F4 Save Log] | Save the acquired control log information to the data storage memory. |
| [F5 Refresh] | Update the latest information on the control log display screen of Remote TP/Virtual TP. |
| [F6 Setting] | Display [Control log settings] window. The settings of "Control log recording time" and "Control log recording interval" can be checked and changed here. |
| [F7 Switch Y-Value display] | Change the display of Y-axis scale between vertical and horizontal. Setting the Y-axis scale to the vertical direction will expand the display range of the graph. |
| [F8 Change axis display range] | Change the display range of the X- or Y-axis. Pressing [F8 Change axis display range] will display the setting window. Select desired operation from the followings.
|
When the Control log is acquired by WINCAPSIII and is exported to the CSV file, the P-type data is exported as well.
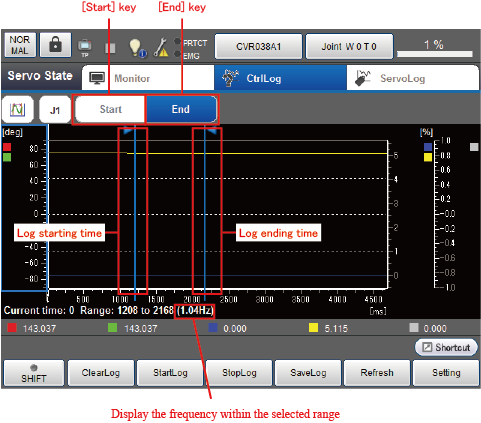
Check The Current (This Function is Available in Ver.2.9.* or Higher.)
| keys | Function |
|---|---|
| [Start] key | Changes the operation target to the start line. |
| [End] key | Changes the operation target to the end line. |
If the start line is not located on the left side of the end line, the frequency is not displayed.
ID : 4074
- Related Information
- Displaying and Changing the Control Log Setting